- Vincent Casser, Kai Kang, Hanspeter Pfister and Daniel Haehn: “Fast Mitochondria Segmentation for Connectomics.” Medical Imaging with Deep Learning (MIDL’20). (full text)

Visit our Project Website (Code available)
NIH HPC Adaptation
Abstract
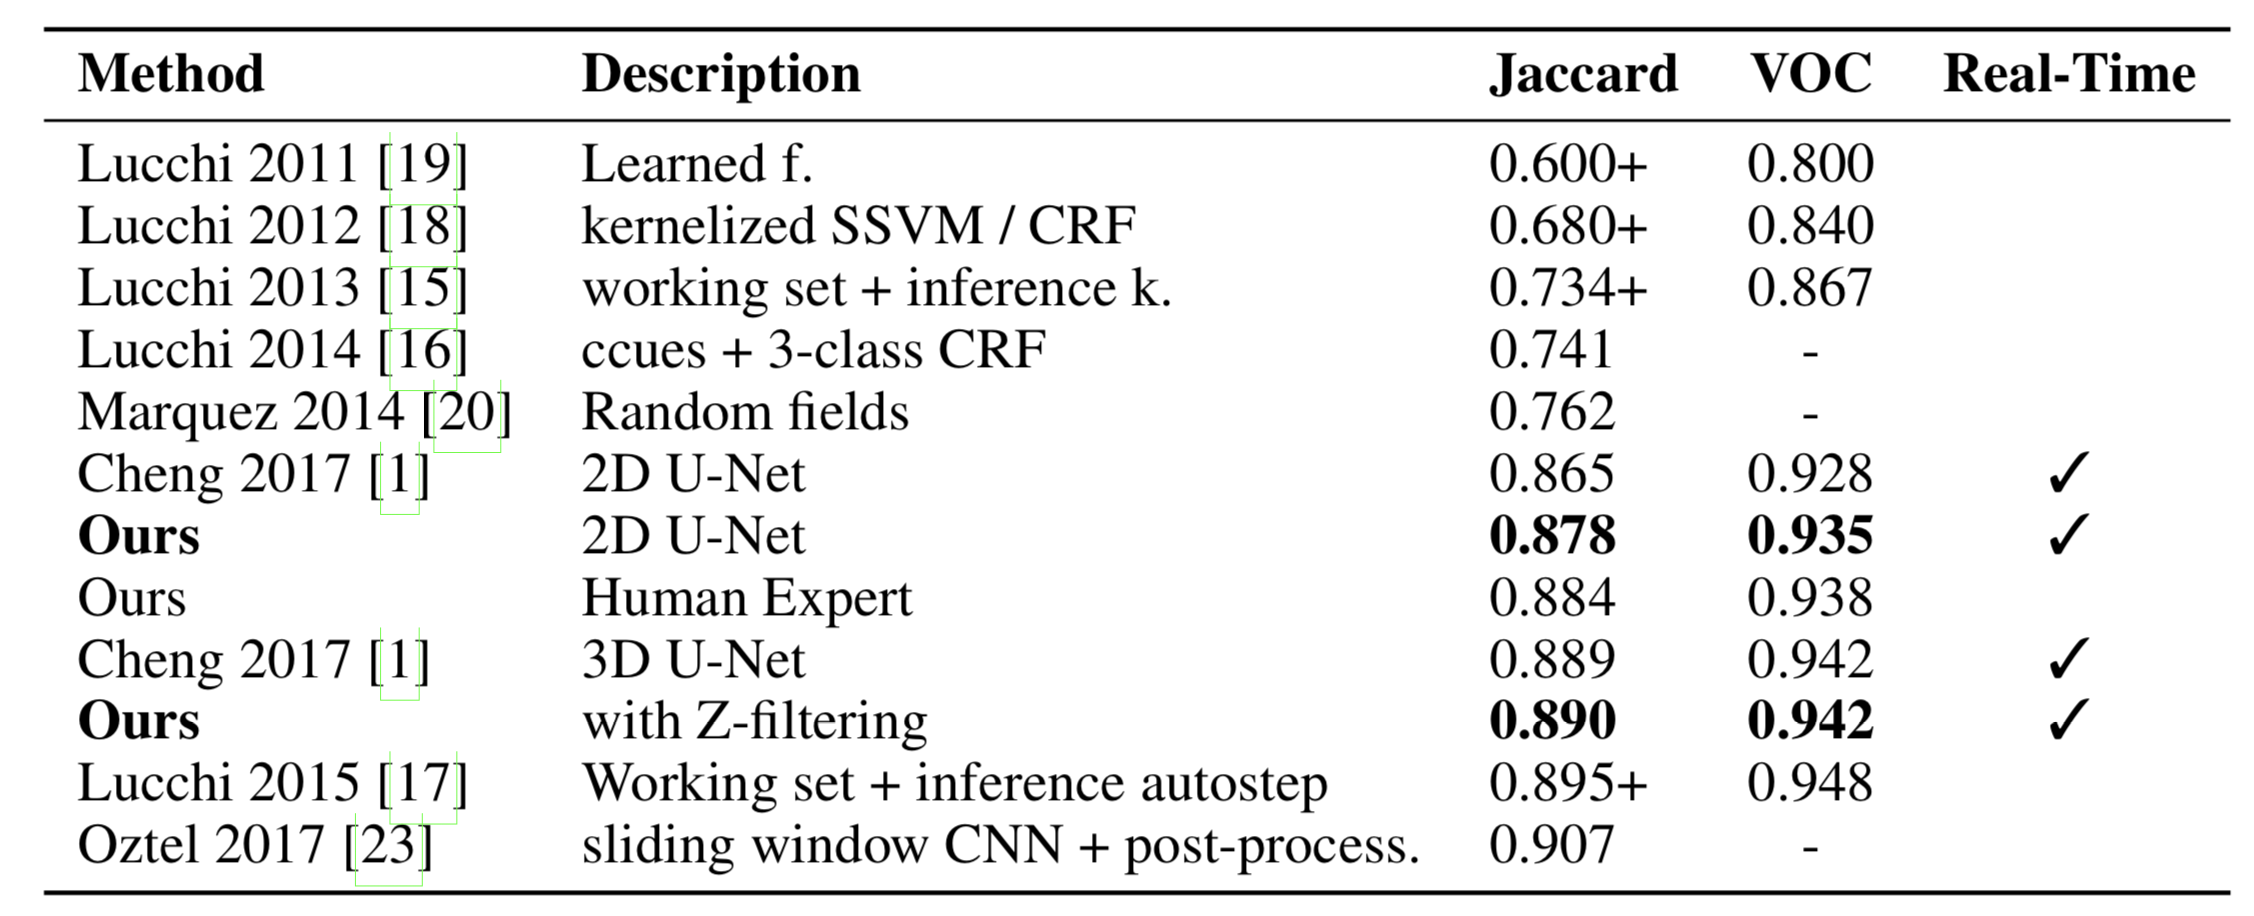
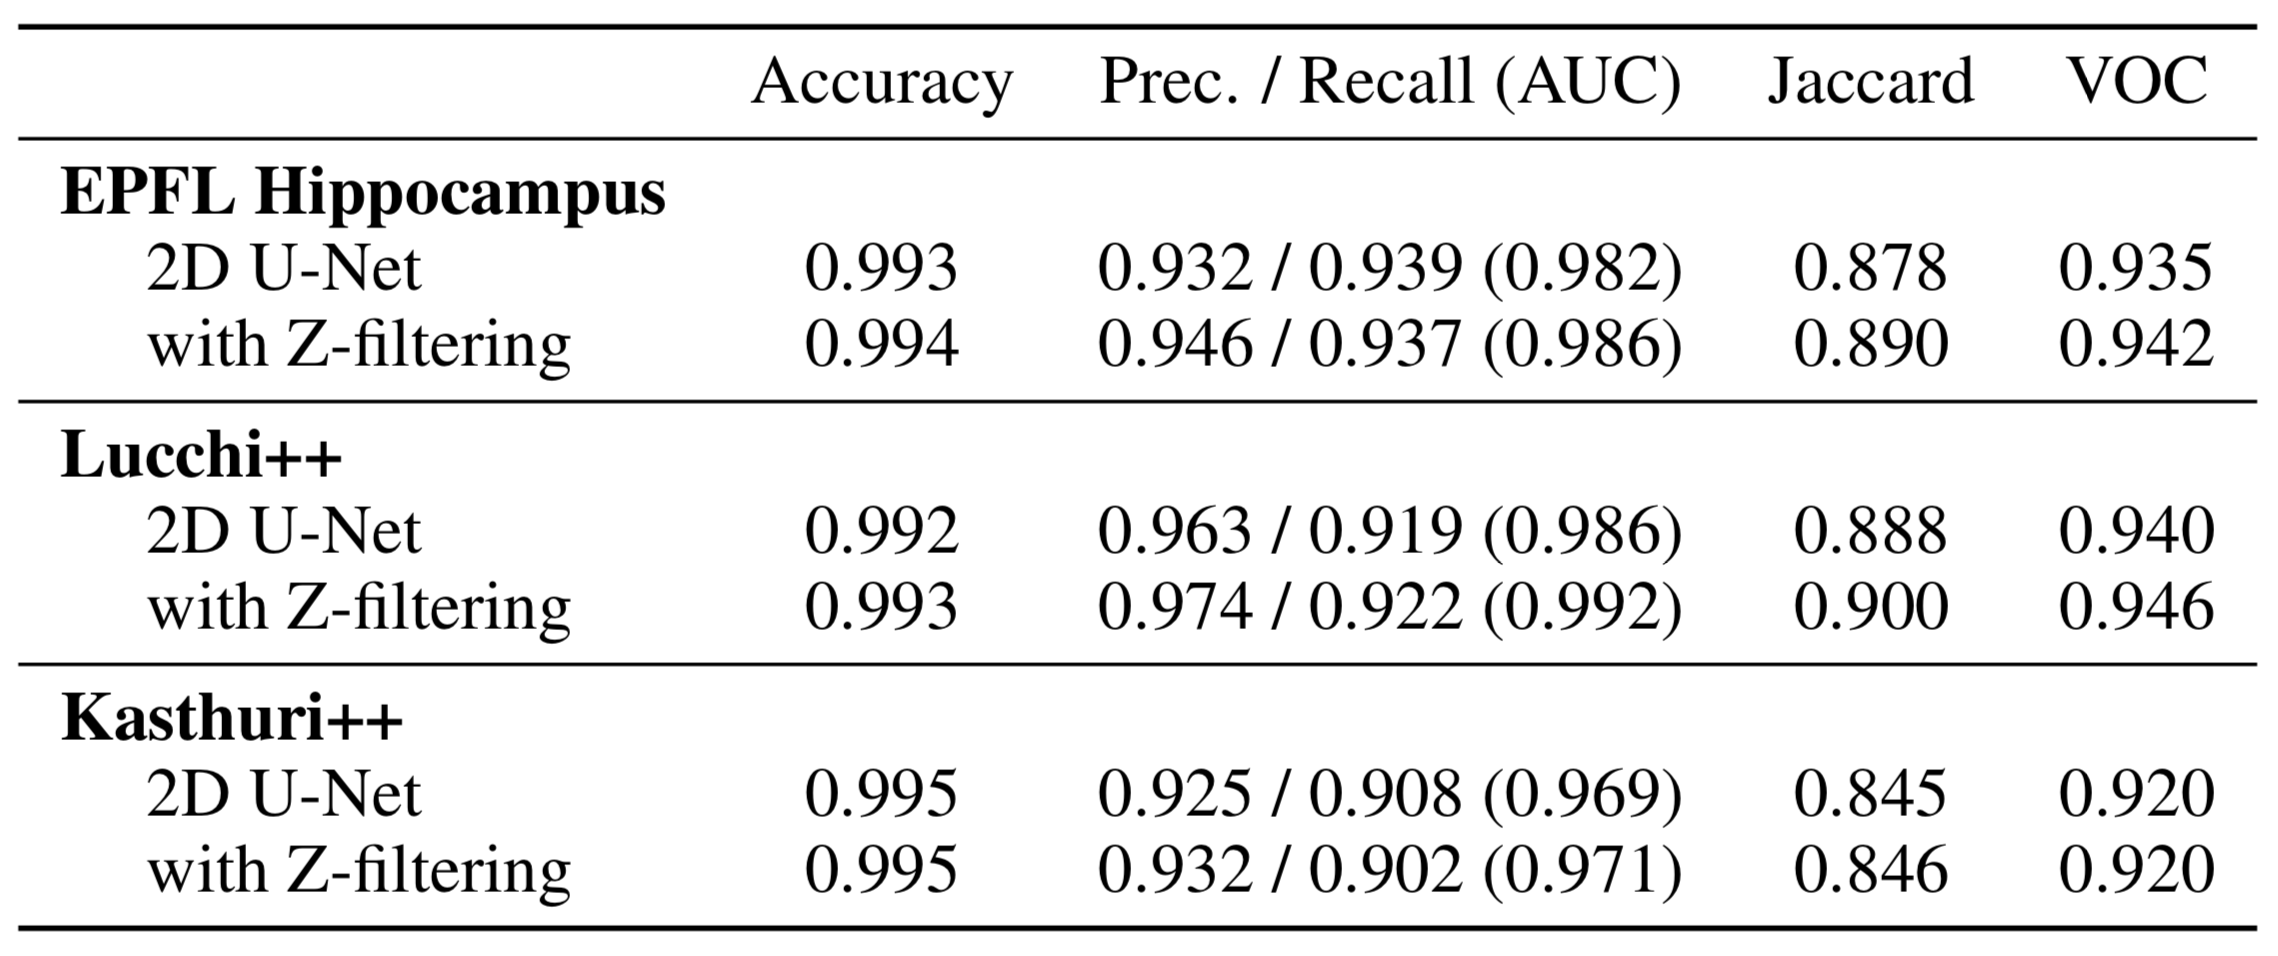
High-resolution connectomics data allows for the identification of dysfunctional mitochondria which are linked to a variety of diseases such as autism or bipolar. However, manual analysis is not feasible since datasets can be petabytes in size. We present a fully automatic mitochondria detector based on a modified U-Net architecture that yields high accuracy and fast processing times. We evaluate our method on multiple real-world connectomics datasets, including an improved version of the EPFL mitochondria benchmark. Our results show a Jaccard index of up to 0.90 with inference times lower than 16ms for a 512 x 512px image tile. This speed is faster than the acquisition speed of modern electron microscopes, enabling mitochondria detection in real-time. Compared to previous work, our detector ranks first for real-time detection and can be used for image alignment. Our data, results, and code are freely available.
Supplementary Material
The segmentation of mitochondria during image acquisition is possible. Our end-to-end detector uses 2D images and automatically produces accurate segmentation masks of high quality in real-time. This is important as connectomics datasets approach petabytes in size. By predicting mitochondria in 2D, parallelization is as trivial as processing sections individually which can further increase throughput. We also confirm previously reported inconsistencies in publicly available segmentation datasets of mitochondria and fix the shortcomings in two available ground truth annotations. We provide the datasets and our code as free and open research in order to facilitate further research. For instance, 2D mitochondria detection could generate additional features to improve robustness of image alignment procedures. As a proof-of-concept, we perform 3D alignment with detected mitochondria. Inspired by spatial transformer networks, we learn the 3D registration of connectomics image slices. We train a DenseNet121 network with custom layers that apply affine and elastic transformations to two neighboring and mis-aligned image slices (fully differentiable, executed on GPU). This allows us to directly regress transformation parameters, and to sample randomly generated synthetic data. For affine transformations, connecting our detector reduces the prediction mean-square-error by 27.01% (2.24%), from 14.097 (4.328) to 11.099 (4.233).
 |
 |
|
|
|
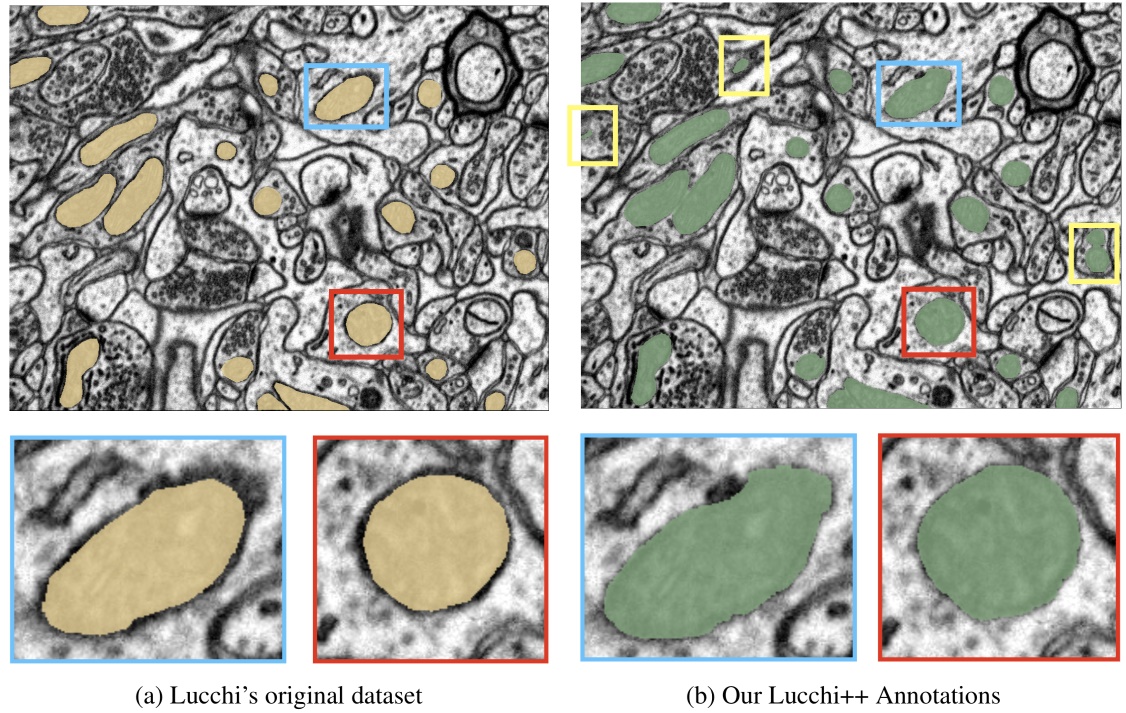
Lucchi++ Mitochondria Segmentation Dataset
This dataset is based on the EPFL Hippocampus dataset, as published in Structured Image Segmentation using Kernelized Features by Lucchi et al [2012]. Our experts re-annotated the two EPFL Hippocampus stacks. Our goal was to achieve consistency for all mitochondria membrane annotations and to correct any misclassifications in the ground truth labelings. First, a senior biologist manually corrected mitochondria membrane labelings using an in-house annotation software. For validation, two neuroscientists were then asked to separately proofread the labelings to judge membrane consistency. We then compared these expert judgments. In cases of disagreement between the neuroscientists, the biologist corrected the annotations until consensus between them was reached. The biologist annotated very precisely and only a handful of membranes had to be corrected after proofreading. To fix misclassifications, our biologist manually looked at every image slice of the two Hippocampus stacks for missing and wrongly labeled mitochondria. The resulting corrections were then again proofread by two neuroscientists until agreement was reached. In several cases it was only possible to identify structures as partial mitochondria by looking at previous sections in the image stacks.
Kasthuri++ Mitochondria Segmentation Dataset
We use the mitochondria annotations of the 3-cylinder mouse cortex volume of Kasthuri et al. The tissue is dense mammalian neuropil from layers 4 and 5 of the S1 primary somatosensory cortex, acquired using serial section electron microscopy (ssEM). Similar to Lucchi’s Hippocampus dataset, we noticed membrane inconsistencies within the mitochondria segmentation masks in this data. We asked our experts to correct these shortcomings through re-annotation of two neighboring sub-volumes leveraging the same process described above for the Lucchi++ dataset. The stack dimensions are 1463 × 1613 × 85vx and 1334 × 1553 × 75vx with a resolution of 3 × 3 × 30nm per voxel.
Download Kasthuri [161 MB] Download Kasthuri++ [158 MB]
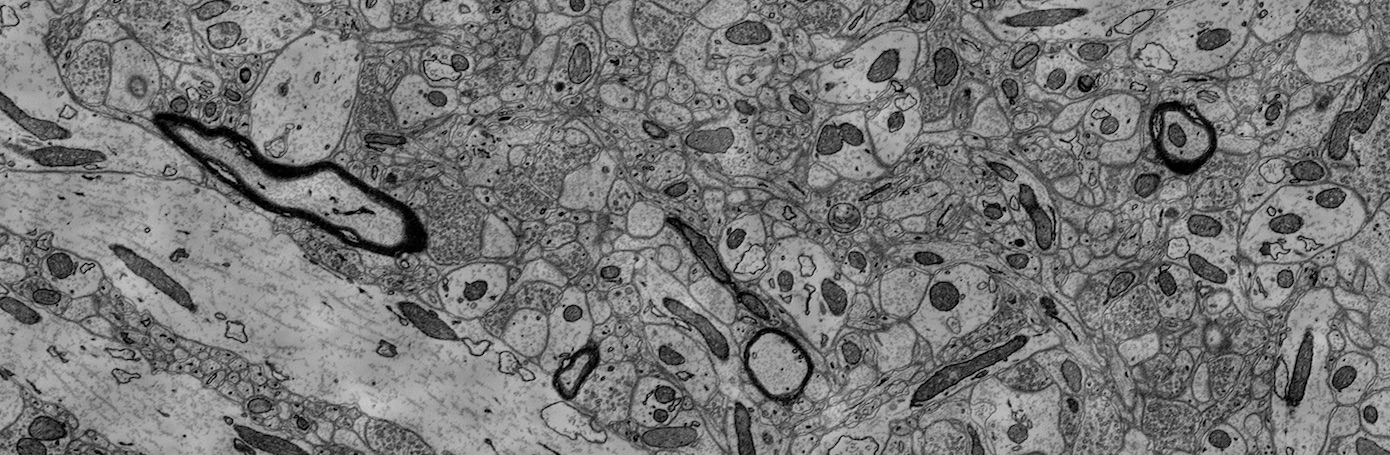
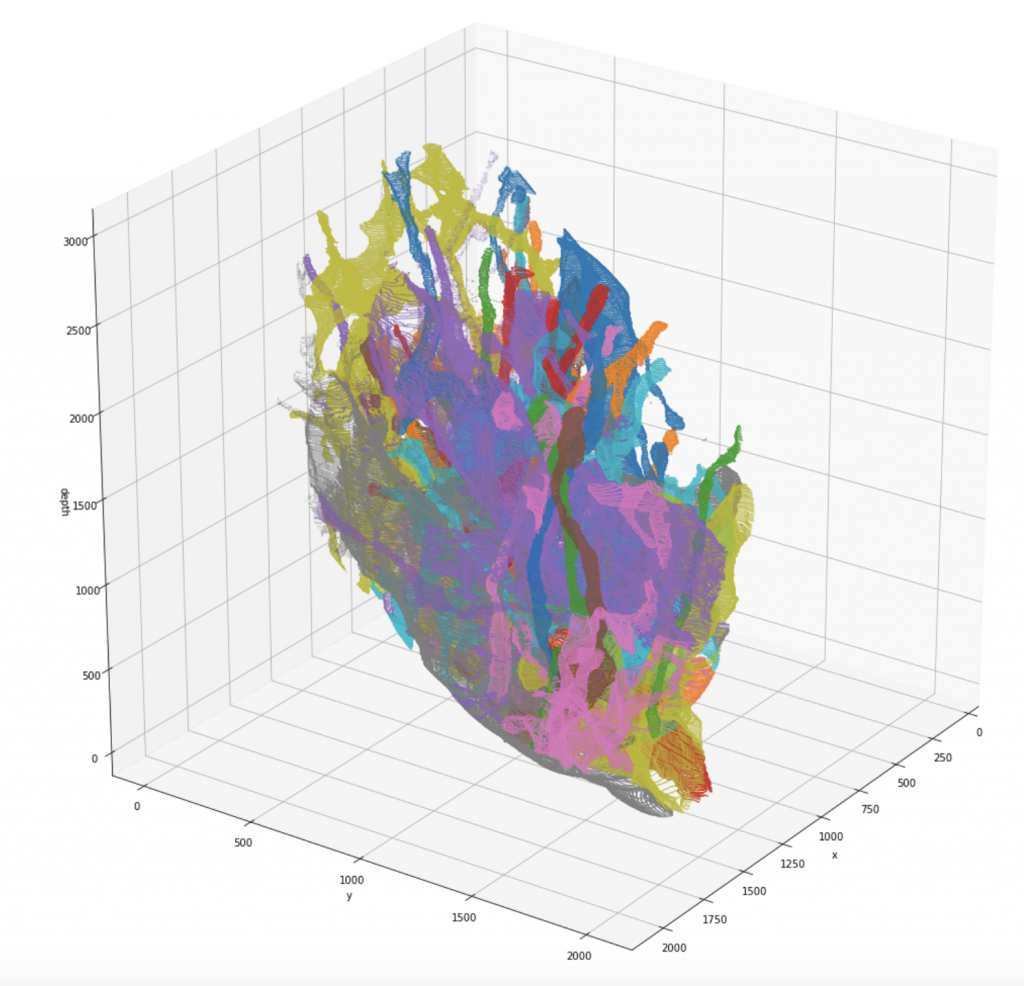
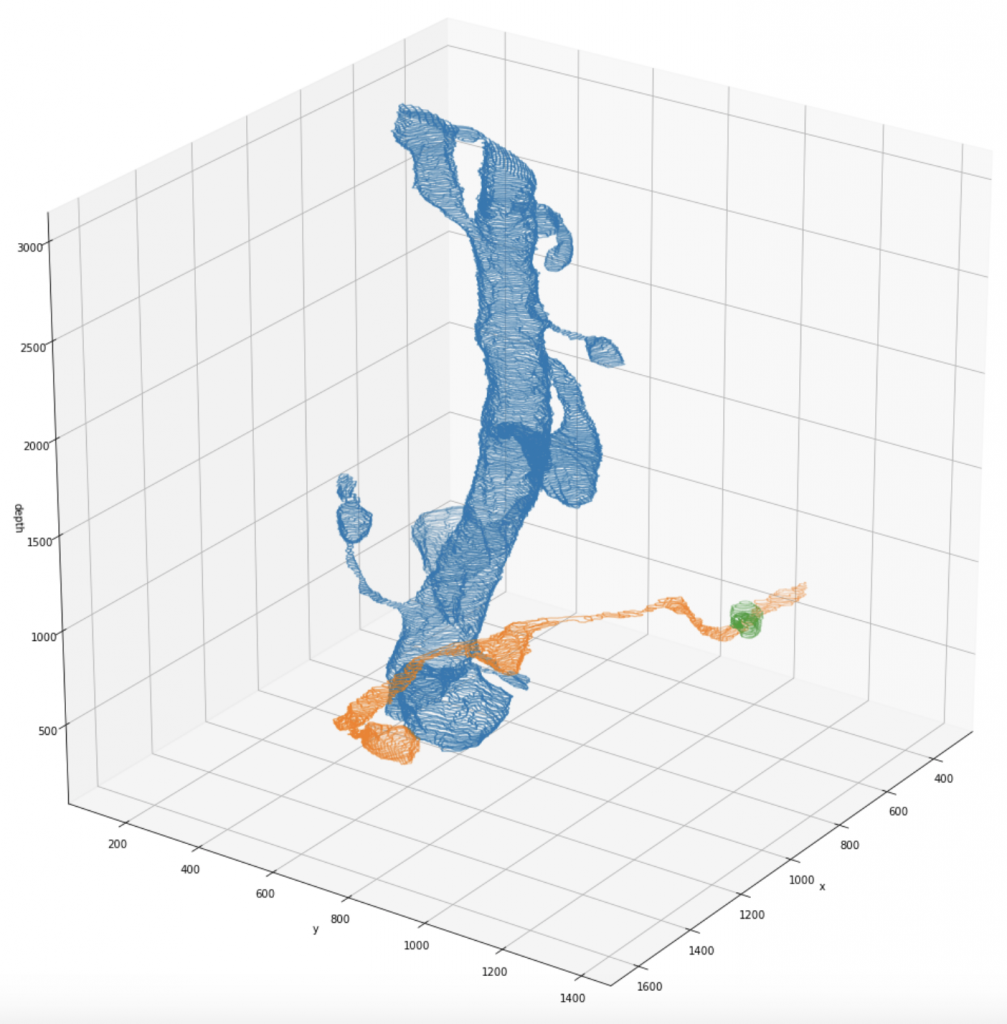
Kasthuri (I) Full Segmentation Dataset
We release a newly pre-processed dataset for research in connectomics, consisting of two fully manually labeled cylinder volumes. The labeling was done by members of the Harvard Lichtman Lab using Daniel Berger’s VAST Lite annotation software, to which the sole ownership of this data belongs. The dataset consists of a 400-element image stack with a resolution of 6nm x 6nm x 30nm/pixel, and the respective segmentation maps that indicate type and which parts of the images belong to each other. Note that for the raw scan images, an additional resolution of 3nm x 3nm x 30nm/pixel might be available on request. We indexed the whole dataset such that one can efficiently query the different annotated segments:
- type specification:
- neurons (excitatory/inhibitory/myelinated/unknown axons, spiny/smooth dendrites)
- glia (astrocytes/oligodendrocytes)
- other/unclassified
- 3D-pointcloud of segments
- cylinder ID it belongs to
- image ID’s in which it is visible
The download includes the raw images, the segmentation maps, the two cylinder outlines as binary masks, and the pre-computed dictionaries for efficient querying.
| Component | Elements |
|---|---|
| Neurons/Dendrites/Smooth | 38 |
| Neurons/Dendrites/Spiny | 1,963 |
| Neurons/Axons/Excitatory | 1,385 |
| Neurons/Axons/Inhibitory | 78 |
| Neurons/Axons/Myelinated | 17 |
| Glia/Astrocytes | 316 |
| Glia/Oligodendrocytes | 12 |
| Other | 25 |
| Overall | 3,827 |
| Thereof only in red cylinder | 1,213 |
| Thereof only in green cylinder | 1,059 |
| Thereof part of both cylinders | 881 |
| Thereof not part of any cylinder | 674 |